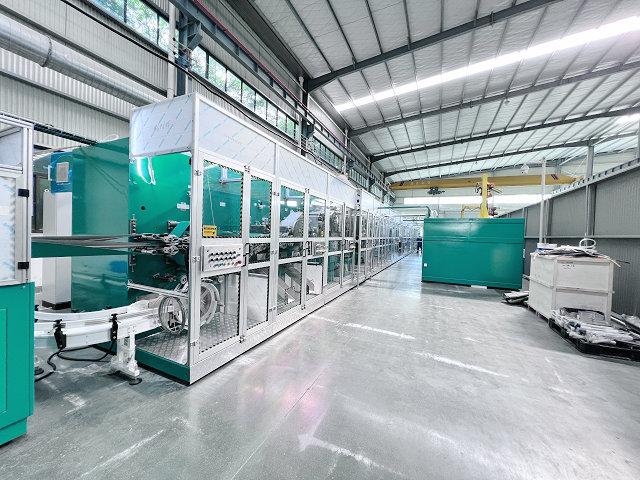
Adult & Baby Diaper Machine,Sanitary Napkins Production Line Blog
Calculate real output from diaper manufacturing equipment using measured run time, operating rate, downtime, quality loss, packing, and accepted products.
Real output from diaper manufacturing equipment is the number of sellable products completed during a defined scheduled period, not design speed multiplied by clock time. Calculate it from measured operating periods, actual running rate, planned and unplanned stops, changeovers, startup losses, quality rejects, and downstream packaging constraints. Keep design speed, demonstrated stable working speed, normal operating speed, and contractual FAT values separate. Use product- and shift-specific data because size, materials, staff, bag format, and maintenance condition change the result. A useful capacity model states its time boundary, counting point, accepted-quality rule, data source, and exclusions so production, procurement, finance, and suppliers can reproduce the calculation.
Define Sellable Output and the Counting Boundary
Choose the output point before collecting numbers. A machine counter may record cut products, while the business needs correctly packed and released products. Between those points, products can be rejected, removed for samples, damaged during transfer, lost in a bagger stop, or held by quality. State whether output means accepted pieces at line discharge, sealed retail packs, cases, or released warehouse units.
Define the time boundary equally clearly. Scheduled shift time may include breaks, cleaning, planned maintenance, material replenishment, meetings, and product changeovers. Some plants exclude planned downtime to calculate equipment performance, but capacity planning still needs those hours. Keep at least two views: production against calendar or scheduled time for business planning, and performance during available machine time for process improvement.
Align counters. Main-line discharge, reject station, stacker, bagger, case packer, and warehouse records may not use the same reset time or product identity. Reconcile opening and closing work in process. A counting audit should explain where one accepted piece enters the business total and how duplicate or missing counts are prevented.
Real output requires one documented counting boundary from machine discharge to accepted packs.
Separate Design Stable and Operating Speed
Design speed is an engineering reference for the machine architecture or a stated maximum under defined conditions. It does not describe how long the line can remain at that speed, which product and materials apply, or how many products pass quality and packing. Do not use it as the default financial capacity.
Stable working speed should refer to a demonstrated rate maintained for an agreed test period with identified materials, product size, quality criteria, and allowed events. If it is contractual, document the acceptance value and method. Operating speed is what the plant selects during normal production. It may be lower because of materials, operator skill, maintenance condition, quality risk, packing, or the desired balance between output and loss.
FAT speed is the rate used in a factory test. It proves only the conditions and duration in the approved procedure. Ramp-up and sustained site output still depend on installation, utilities, local materials, training, packing, maintenance, and management. Record every speed with its product, timestamp, duration, and reason for change.
Build a Scheduled Time Waterfall
Start with scheduled minutes for the defined period. Subtract planned nonproduction time such as approved maintenance, sanitation, product changeover, meal shutdowns where the line is stopped, and planned trials. The result is planned operating time. Then subtract unplanned stops, including mechanical faults, electrical faults, material shortages, quality holds, adhesive problems, utility loss, and downstream blockage.
Do not hide frequent short stops. A large breakdown is visible, but repeated sensor checks, web breaks, jams, roll delays, and bagger interruptions can remove more time in total. Define a minimum event duration for automatic logging and provide an operator method for shorter recurring events. Use a controlled cause list, with an unknown category that must be reviewed rather than guessed.
Track starved and blocked conditions separately. Starved means the machine cannot run because required material or input is unavailable. Blocked means downstream equipment cannot accept output. These losses may occur outside the converting machine but still reduce sellable line capacity.
A time waterfall makes planned stops, faults, starvation, and downstream blockage visible.
Measure Running Rate by Product and Event
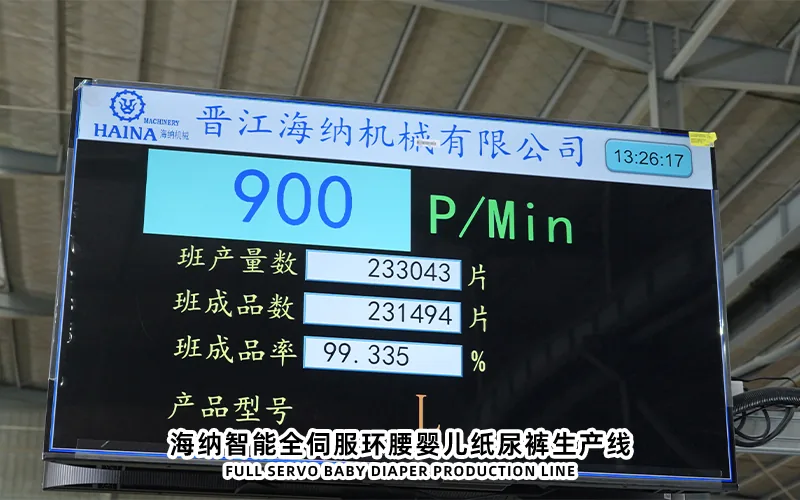
Calculate running rate from actual counted products divided by actual running minutes over a defined interval. Avoid averaging only displayed setpoints. Capture the master speed command, actual product count, and periods when the line is accelerating, decelerating, or running below target. A line that reaches a high rate briefly may have a lower weighted rate across the shift.
Segment results by product size, material set, packing format, crew, and shift when enough data exist. A larger size may change web handling, tool loading, folding, or pack compression. A material with different stretch, friction, thickness, or roll quality may change stable settings. Combining all products into one average can hide both strong and weak conditions.
Record rate loss as the difference between chosen target rate and measured running rate during available operation. Investigate whether the cause is intentional quality protection, speed ramp, reduced-rate fault recovery, operator practice, process instability, or packaging balance. The response differs for each cause.
Subtract Startup Process and Quality Losses
Count all products made during setup and startup, then classify their disposition. Some are intentionally removed while web paths, registration, adhesive, tension, or cutting settle. Others fail defined quality requirements. Samples taken for inspection are not defects but still are not shipped unless returned under a controlled rule. Keep these categories separate.
During steady production, record automatic rejects, manual removals, destructive tests, damaged stacks, packaging rejects, and quality holds. Reconcile them with total production. A reject percentage without a known denominator and counting point cannot support cost or capacity decisions.
Use defect categories linked to product features and process zones. Examples may include core placement, material presence, tape position, elastic behavior, cut position, fold, contamination, count, bag seal, or code. Do not infer product quality only from machine alarms. Confirm accepted output through the agreed sampling and release process.
Startup waste, automatic rejects, samples, and packaging loss need distinct records.
Include Packing and Material Supply Constraints
Output is constrained by the slowest required process over time. The stacker or auto bagger may have a suitable nominal rate but lose availability during bag replenishment, sealing adjustment, code changes, or jams. Define how the main line responds, whether accumulation exists, and which counter represents accepted packed output.
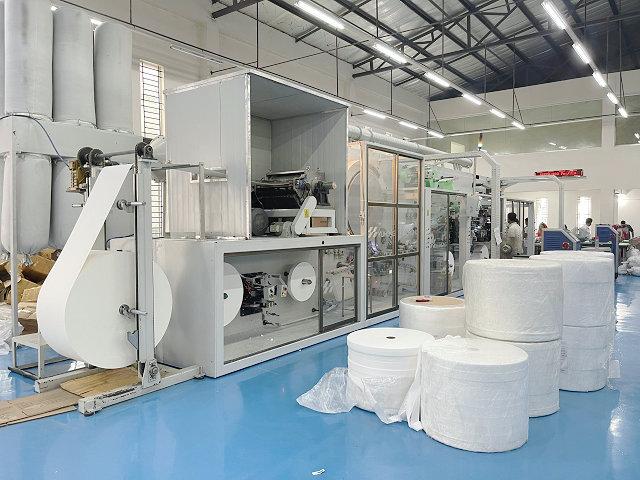
Material logistics also set capacity. Measure how often rolls, SAP, pulp, adhesive, bags, and cases are replenished; how many people and lifting devices are required; and whether routes remain clear. Automatic splicing can reduce a planned roll stop, but it may add splice-preparation work and rejected products around the event. Count the complete event.
Warehouse and quality release can constrain shipments even if the line runs. Capacity planning should check laboratory sampling, retained products, pallet handling, quarantine space, and final data entry. These activities should not be assigned to equipment performance, but they belong in the sellable-output system.
Calculate Output With Transparent Scenarios
Use a simple chain that every department can audit. Available running minutes equal scheduled minutes minus planned and unplanned stop minutes. Gross produced pieces equal the sum of actual running rate multiplied by minutes for each operating interval. Sellable pieces equal gross produced pieces minus all products not released for sale at the chosen boundary.
For planning before enough local data exist, build conservative, expected, and demonstrated scenarios. Use supplier test evidence only under its stated product and conditions. Apply separate assumptions for availability, weighted operating rate, changeover, and quality yield. Never multiply design speed by every scheduled minute and then apply one unexplained efficiency factor.
Report uncertainty beside the scenarios. Mark which inputs are measured, contractually tested, estimated from a similar process, or still unknown. Give each assumption an owner and replacement date. This keeps an early planning model useful without allowing provisional figures to harden into unsupported commitments.
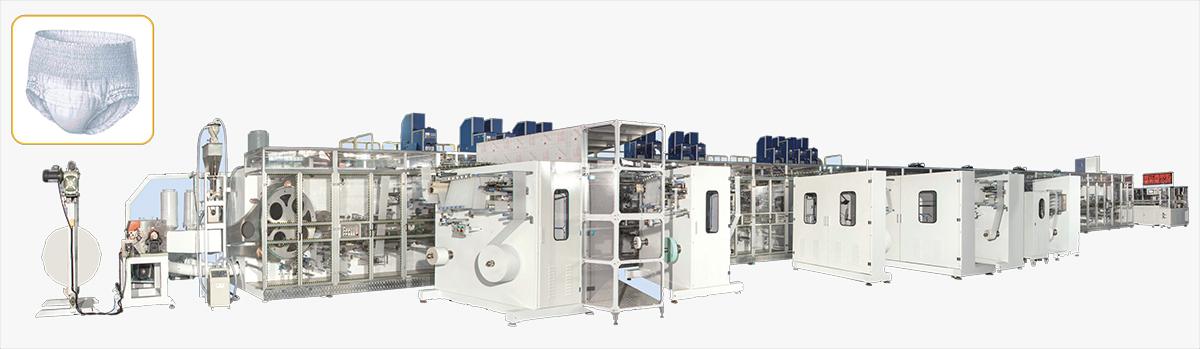
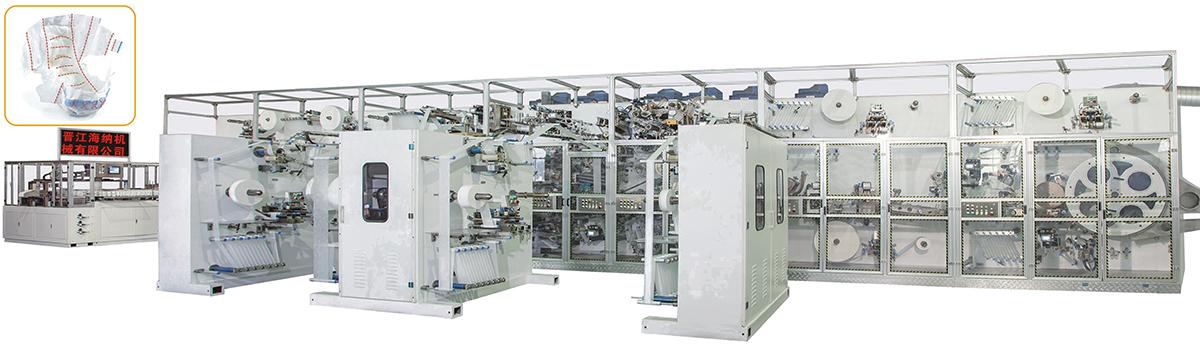
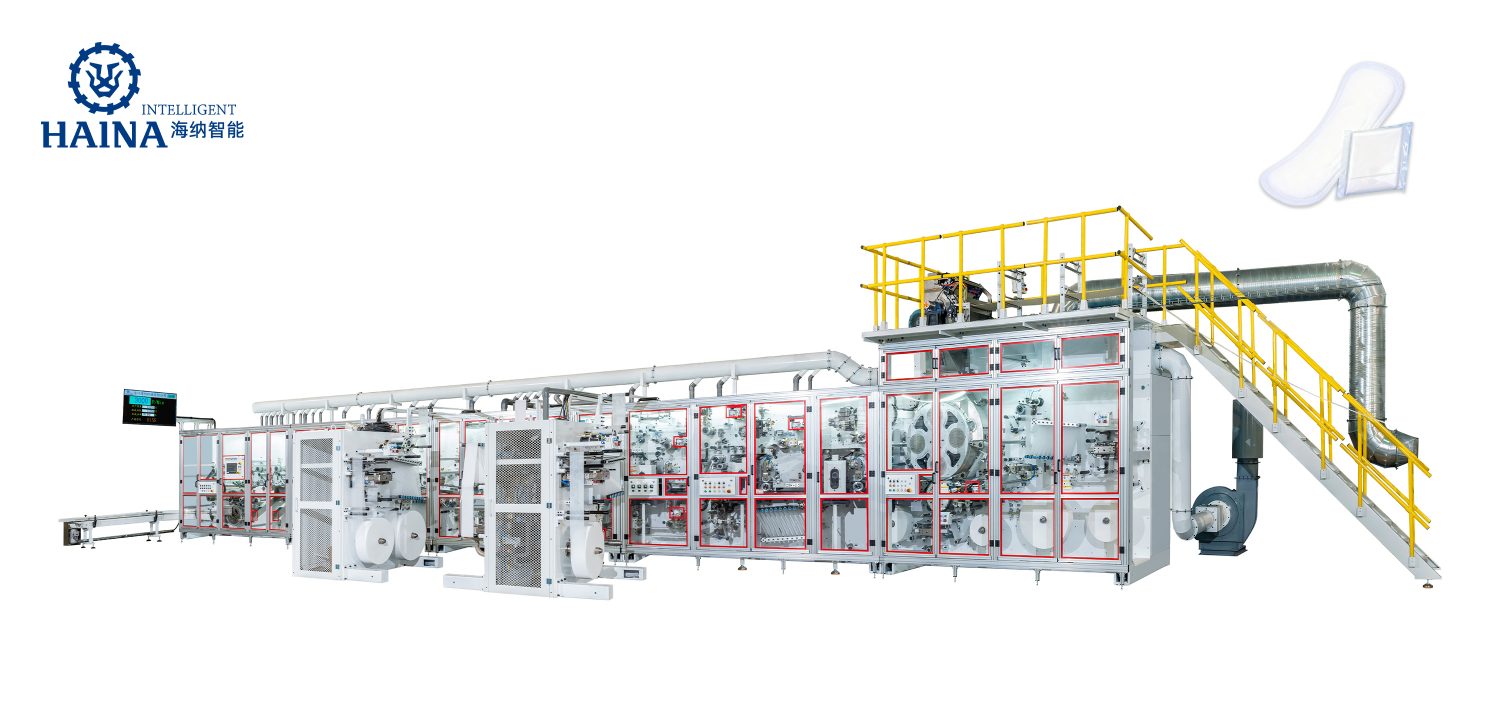
For an automatic baby diaper manufacturing machine review, HAINA can be asked to identify test conditions, counters, events, and product scope. The buyer should place these values into its own staffing, packing, material, and schedule model. Keep assumptions editable so measured ramp-up data can replace them.
Calculation note: Report the equation and every input beside the result. A capacity number without its time basis, operating rate, losses, quality rule, and output boundary is not reproducible.
Use an Output Data Definition Table
Data item
Definition
Preferred source
Common error
Scheduled minutes
Clock time assigned to this product and line
Approved production schedule
Excluding planned stops without disclosure
Running minutes
Time producing through the chosen counting point
Machine event log reconciled by operator
Counting idle or threaded time as running
Actual running rate
Gross count divided by running minutes for an interval
Timestamped counters
Using displayed setpoint or design speed
Loss count
Startup, reject, sample, damage, hold, and packing loss
Reject counters and quality records
Mixing defects with legitimate samples
Sellable output
Products meeting release rules at the declared boundary
Reconciled production and quality record
Reporting cut pieces as shipped products
Validate the Model During FAT and Ramp Up
Freeze definitions: agree product, materials, time basis, counter, output boundary, speeds, and quality rules.
Witness the FAT: record duration, operating intervals, stops, rate changes, gross count, rejects, samples, and accepted result.
Start site baselines: measure utility-ready trial runs before mixing commissioning work with normal production.
Segment ramp-up: compare by product, material, crew, and pack format and replace estimates with evidence.
Review constraints: rank time, rate, quality, material, and packing losses by recoverable output.
Capacity becomes credible when machine, quality, and packing counts reconcile over the same period.
Real Output FAQ
Is design speed ever useful for capacity planning?
It is useful as a technical reference and constraint, but business output should use supported operating rates, availability, changeovers, quality yield, and packaging performance.
Should planned maintenance be excluded from output calculations?
Show both views. Exclude it when analyzing available equipment performance if your definition requires that, but include it in calendar and business capacity.
How should short stops be counted?
Use automatic event records where possible and a controlled operator category for events below the logging threshold. Review frequent patterns rather than ignoring them.
Why can packed output be lower than line discharge count?
Products may be sampled, rejected, damaged, blocked, incorrectly counted, or lost during stack and bag handling. Reconcile all downstream dispositions.
Conclusion
Real output is a measured flow of accepted products through a declared time and process boundary. Separate speed definitions, build the time waterfall, count every loss, and include material and packing constraints. A transparent model lets buyers test supplier evidence, lets factories improve the largest losses, and lets finance plan from sellable output instead of an unsupported maximum-speed calculation.